Forex Trend Analysis Report
Prepared for you on Friday, March 27, 2026.
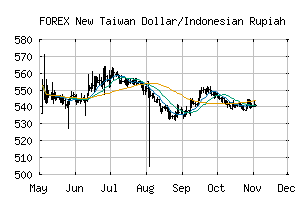
New Taiwan Dollar/Indonesian Rupiah (FOREX:TWDIDR)
Countertrend Down (-85) - TWDIDR is showing short-term strength. However, look for the longer-term bearish trend to resume. As always, continue to monitor the trend score and set stops.
Is it time to buy, sell, or avoid TWDIDR?
MarketClub looks at technical strength and momentum to determine if the timing is right for TWDIDR.
Learn more about the Trade Triangles and how we make technical analysis as easy as buy and sell.
|
|||||||||||||||
|
|||||||||||||||
MarketClub’s Trade Triangles for TWDIDR
![]() The long-term trend has been DOWN since Aug 4th, 2025 at 515.57809
The long-term trend has been DOWN since Aug 4th, 2025 at 515.57809
![]() The intermediate-term trend has been DOWN since Mar 13th, 2026 at 528.53448
The intermediate-term trend has been DOWN since Mar 13th, 2026 at 528.53448
![]() The short-term trend has been UP since Mar 27th, 2026 at 531.12433
The short-term trend has been UP since Mar 27th, 2026 at 531.12433
Smart Scan Analysis for TWDIDR
Based on our trend formula, TWDIDR is rated as a -85 on a scale from -100 (Strong Downtrend) to +100 (Strong Uptrend).
| Open | High | Low | Price | Change |
|---|---|---|---|---|
| 531.06991 | 531.83825 | 529.37397 | 529.97046 | -1.09945 |
| Prev. Close | Volume | Bid | Ask | Time |
| 531.06991 | 2026-03-27 13:17:13 |