Forex Trend Analysis Report
Prepared for you on Wednesday, April 8, 2026.
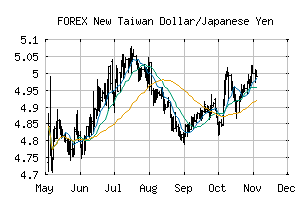
New Taiwan Dollar/Japanese Yen (FOREX:TWDJPY)
Sidelines Mode (+55) - TWDJPY is moving in a sideways pattern and is unable to gain momentum in either direction. Beware of choppy movement and consider a sidelines position until a stronger trend is identified.
Is it time to buy, sell, or avoid TWDJPY?
MarketClub looks at technical strength and momentum to determine if the timing is right for TWDJPY.
Learn more about the Trade Triangles and how we make technical analysis as easy as buy and sell.
|
|||||||||||||||
|
|||||||||||||||
MarketClub’s Trade Triangles for TWDJPY
![]() The long-term trend has been DOWN since Feb 11th, 2026 at 4.8559287
The long-term trend has been DOWN since Feb 11th, 2026 at 4.8559287
![]() The intermediate-term trend has been UP since Feb 25th, 2026 at 4.9927738
The intermediate-term trend has been UP since Feb 25th, 2026 at 4.9927738
![]() The short-term trend has been DOWN since Apr 7th, 2026 at 4.9811039
The short-term trend has been DOWN since Apr 7th, 2026 at 4.9811039
Smart Scan Analysis for TWDJPY
Based on our trend formula, TWDJPY is rated as a +55 on a scale from -100 (Strong Downtrend) to +100 (Strong Uptrend).
| Open | High | Low | Price | Change |
|---|---|---|---|---|
| 4.9856769 | 4.9950164 | 4.9773708 | 4.9942775 | +0.0086010 |
| Prev. Close | Volume | Bid | Ask | Time |
| 4.9856769 | 2026-04-08 14:01:06 |