Forex Trend Analysis Report
Prepared for you on Sunday, February 8, 2026.
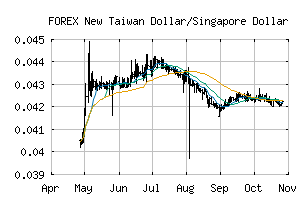
New Taiwan Dollar/Singapore Dollar (FOREX:TWDSGD)
Strong Downtrend (-100) - TWDSGD is in a strong downtrend that is likely to continue. With short-term, intermediate, and long-term bearish momentum, TWDSGD continues to fall. Traders should use caution and set stops.
Is it time to buy, sell, or avoid TWDSGD?
MarketClub looks at technical strength and momentum to determine if the timing is right for TWDSGD.
Learn more about the Trade Triangles and how we make technical analysis as easy as buy and sell.
|
|||||||||||||||
|
|||||||||||||||
MarketClub’s Trade Triangles for TWDSGD
![]() The long-term trend has been DOWN since Aug 4th, 2025 at 0.04070997
The long-term trend has been DOWN since Aug 4th, 2025 at 0.04070997
![]() The intermediate-term trend has been DOWN since Nov 16th, 2025 at 0.04166497
The intermediate-term trend has been DOWN since Nov 16th, 2025 at 0.04166497
![]() The short-term trend has been DOWN since Feb 6th, 2026 at 0.04012278
The short-term trend has been DOWN since Feb 6th, 2026 at 0.04012278
Smart Scan Analysis for TWDSGD
Based on our trend formula, TWDSGD is rated as a -100 on a scale from -100 (Strong Downtrend) to +100 (Strong Uptrend).
| Open | High | Low | Price | Change |
|---|---|---|---|---|
| 0.04024328 | 0.04024328 | 0.04024328 | 0.04024328 | 0.00000000 |
| Prev. Close | Volume | Bid | Ask | Time |
| 0.04024328 | 2026-02-08 02:18:33 |