Forex Trend Analysis Report
Prepared for you on Wednesday, March 11, 2026.
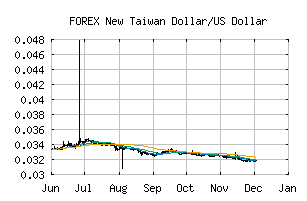
New Taiwan Dollar/US Dollar (FOREX:TWDUSD)
Bear Market Rally (-75) - TWDUSD is showing some rallying power, but still remains in the confines of a long-term downtrend. Keep an eye on TWDUSD as it may be in the beginning of a reversal.
Is it time to buy, sell, or avoid TWDUSD?
MarketClub looks at technical strength and momentum to determine if the timing is right for TWDUSD.
Learn more about the Trade Triangles and how we make technical analysis as easy as buy and sell.
|
|||||||||||||||
|
|||||||||||||||
MarketClub’s Trade Triangles for TWDUSD
![]() The long-term trend has been DOWN since Aug 4th, 2025 at 0.03110810
The long-term trend has been DOWN since Aug 4th, 2025 at 0.03110810
![]() The intermediate-term trend has been DOWN since Mar 3rd, 2026 at 0.03155073
The intermediate-term trend has been DOWN since Mar 3rd, 2026 at 0.03155073
![]() The short-term trend has been UP since Mar 11th, 2026 at 0.03157750
The short-term trend has been UP since Mar 11th, 2026 at 0.03157750
Smart Scan Analysis for TWDUSD
Based on our trend formula, TWDUSD is rated as a -75 on a scale from -100 (Strong Downtrend) to +100 (Strong Uptrend).
| Open | High | Low | Price | Change |
|---|---|---|---|---|
| 0.03148863 | 0.03161256 | 0.03134158 | 0.03153480 | +0.00004600 |
| Prev. Close | Volume | Bid | Ask | Time |
| 0.03148863 | 2026-03-11 15:28:34 |