Forex Trend Analysis Report
Prepared for you on Saturday, March 28, 2026.
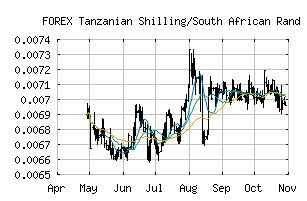
Tanzanian Shilling/South African Rand (FOREX:TZSZAR)
Crossroads (+60) - TZSZAR is struggling to move into a solid trend. Beware of choppy markets and consider a sidelines position until a stronger trend is identified.
Is it time to buy, sell, or avoid TZSZAR?
MarketClub looks at technical strength and momentum to determine if the timing is right for TZSZAR.
Learn more about the Trade Triangles and how we make technical analysis as easy as buy and sell.
|
|||||||||||||||
|
|||||||||||||||
MarketClub’s Trade Triangles for TZSZAR
![]() The long-term trend has been DOWN since Dec 11th, 2025 at 0.00688948
The long-term trend has been DOWN since Dec 11th, 2025 at 0.00688948
![]() The intermediate-term trend has been UP since Mar 1st, 2026 at 0.00630444
The intermediate-term trend has been UP since Mar 1st, 2026 at 0.00630444
![]() The short-term trend has been UP since Mar 18th, 2026 at 0.00649810
The short-term trend has been UP since Mar 18th, 2026 at 0.00649810
Smart Scan Analysis for TZSZAR
Based on our trend formula, TZSZAR is rated as a +60 on a scale from -100 (Strong Downtrend) to +100 (Strong Uptrend).
| Open | High | Low | Price | Change |
|---|---|---|---|---|
| 0.00662428 | 0.00668275 | 0.00659134 | 0.00664471 | +0.00002000 |
| Prev. Close | Volume | Bid | Ask | Time |
| 0.00664471 | 2026-03-27 17:55:46 |