Forex Trend Analysis Report
Prepared for you on Tuesday, April 7, 2026.
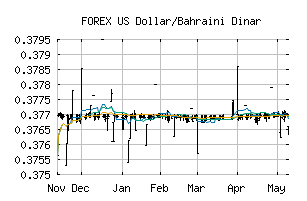
US Dollar/Bahraini Dinar (FOREX:USDBHD)
Weak Uptrend (+65) - USDBHD is showing signs of weakening momentum to the upside. Monitor USDBHD as it may be in the beginning stages of a reversal.
Is it time to buy, sell, or avoid USDBHD?
MarketClub looks at technical strength and momentum to determine if the timing is right for USDBHD.
Learn more about the Trade Triangles and how we make technical analysis as easy as buy and sell.
|
|||||||||||||||
|
|||||||||||||||
MarketClub’s Trade Triangles for USDBHD
![]() The long-term trend has been UP since Jan 30th, 2026 at 0.37813720
The long-term trend has been UP since Jan 30th, 2026 at 0.37813720
![]() The intermediate-term trend has been UP since Apr 3rd, 2026 at 0.37914363
The intermediate-term trend has been UP since Apr 3rd, 2026 at 0.37914363
![]() The short-term trend has been DOWN since Apr 7th, 2026 at 0.37816257
The short-term trend has been DOWN since Apr 7th, 2026 at 0.37816257
Smart Scan Analysis for USDBHD
Based on our trend formula, USDBHD is rated as a +65 on a scale from -100 (Strong Downtrend) to +100 (Strong Uptrend).
| Open | High | Low | Price | Change |
|---|---|---|---|---|
| 0.37752825 | 0.37758673 | 0.37752825 | 0.37755248 | +0.00002400 |
| Prev. Close | Volume | Bid | Ask | Time |
| 0.37752825 | 2026-04-07 12:35:15 |