Forex Trend Analysis Report
Prepared for you on Tuesday, March 3, 2026.
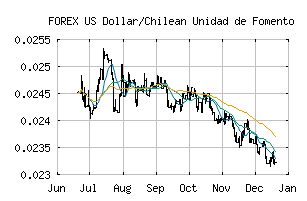
US Dollar/Chilean Unidad de Fomento (FOREX:USDCLF)
Crossroads (+60) - USDCLF is struggling to move into a solid trend. Beware of choppy markets and consider a sidelines position until a stronger trend is identified.
Is it time to buy, sell, or avoid USDCLF?
MarketClub looks at technical strength and momentum to determine if the timing is right for USDCLF.
Learn more about the Trade Triangles and how we make technical analysis as easy as buy and sell.
|
|||||||||||||||
|
|||||||||||||||
MarketClub’s Trade Triangles for USDCLF
![]() The long-term trend has been DOWN since Feb 4th, 2025 at 0.03449708
The long-term trend has been DOWN since Feb 4th, 2025 at 0.03449708
![]() The intermediate-term trend has been UP since Feb 27th, 2026 at 0.02205590
The intermediate-term trend has been UP since Feb 27th, 2026 at 0.02205590
![]() The short-term trend has been UP since Feb 27th, 2026 at 0.02196675
The short-term trend has been UP since Feb 27th, 2026 at 0.02196675
Smart Scan Analysis for USDCLF
Based on our trend formula, USDCLF is rated as a +60 on a scale from -100 (Strong Downtrend) to +100 (Strong Uptrend).
| Open | High | Low | Price | Change |
|---|---|---|---|---|
| 0.02236639 | 0.02236639 | 0.02236639 | 0.02236639 | 0.00000000 |
| Prev. Close | Volume | Bid | Ask | Time |
| 0.02236639 | 2026-03-03 00:40:16 |