Forex Trend Analysis Report
Prepared for you on Tuesday, April 7, 2026.
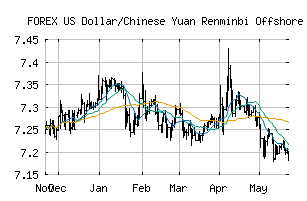
US Dollar/Chinese Yuan Renminbi Offshore (FOREX:USDCNH)
Strong Downtrend (-100) - USDCNH is in a strong downtrend that is likely to continue. With short-term, intermediate, and long-term bearish momentum, USDCNH continues to fall. Traders should use caution and set stops.
Is it time to buy, sell, or avoid USDCNH?
MarketClub looks at technical strength and momentum to determine if the timing is right for USDCNH.
Learn more about the Trade Triangles and how we make technical analysis as easy as buy and sell.
|
|||||||||||||||
|
|||||||||||||||
MarketClub’s Trade Triangles for USDCNH
![]() The long-term trend has been DOWN since May 2nd, 2025 at 7.21525
The long-term trend has been DOWN since May 2nd, 2025 at 7.21525
![]() The intermediate-term trend has been DOWN since Apr 7th, 2026 at 6.87103
The intermediate-term trend has been DOWN since Apr 7th, 2026 at 6.87103
![]() The short-term trend has been DOWN since Mar 31st, 2026 at 6.90579
The short-term trend has been DOWN since Mar 31st, 2026 at 6.90579
Smart Scan Analysis for USDCNH
Based on our trend formula, USDCNH is rated as a -100 on a scale from -100 (Strong Downtrend) to +100 (Strong Uptrend).
| Open | High | Low | Price | Change |
|---|---|---|---|---|
| 6.88005 | 6.88018 | 6.85392 | 6.85540 | -0.02465 |
| Prev. Close | Volume | Bid | Ask | Time |
| 6.88005 | 2026-04-07 17:31:59 |