Forex Trend Analysis Report
Prepared for you on Wednesday, July 30, 2025.
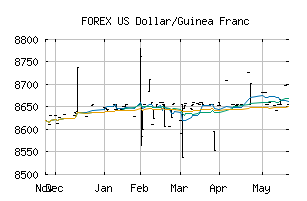
US Dollar/Guinea Franc (FOREX:USDGNF)
Weak Downtrend (-65) - USDGNF is showing signs of a strengthening downtrend. Monitor USDGNF as it may be building momentum to the downside.
Is it time to buy, sell, or avoid USDGNF?
MarketClub looks at technical strength and momentum to determine if the timing is right for USDGNF.
Learn more about the Trade Triangles and how we make technical analysis as easy as buy and sell.
|
|||||||||||||||
|
|||||||||||||||
MarketClub’s Trade Triangles for USDGNF
![]() The long-term trend has been UP since Jul 15th, 2025 at 8727.506
The long-term trend has been UP since Jul 15th, 2025 at 8727.506
![]() The intermediate-term trend has been DOWN since Jul 17th, 2025 at 8655.000
The intermediate-term trend has been DOWN since Jul 17th, 2025 at 8655.000
![]() The short-term trend has been DOWN since Jul 29th, 2025 at 8663.234
The short-term trend has been DOWN since Jul 29th, 2025 at 8663.234
Smart Scan Analysis for USDGNF
Based on our trend formula, USDGNF is rated as a -70 on a scale from -100 (Strong Downtrend) to +100 (Strong Uptrend).
| Open | High | Low | Price | Change |
|---|---|---|---|---|
| 8656 | 8656 | 8656 | 8656 | 0 |
| Prev. Close | Volume | Bid | Ask | Time |
| 8656 | 2025-07-30 13:12:56 |