Forex Trend Analysis Report
Prepared for you on Saturday, December 21, 2024.
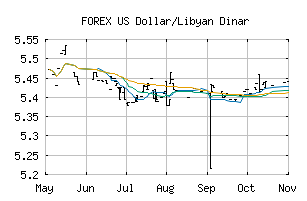
US Dollar/Libyan Dinar (FOREX:USDLYD)
Bull Market Weakness (+75) - USDLYD is showing signs of short-term weakness, but still remains in the confines of a long-term uptrend. Keep an eye on USDLYD as it may be in the beginning stages of a reversal.
Is it time to buy, sell, or avoid USDLYD?
MarketClub looks at technical strength and momentum to determine if the timing is right for USDLYD.
Learn more about the Trade Triangles and how we make technical analysis as easy as buy and sell.
|
|||||||||||||||
|
|||||||||||||||
MarketClub’s Trade Triangles for USDLYD
![]() The long-term trend has been UP since Nov 6th, 2024 at 4.8300000
The long-term trend has been UP since Nov 6th, 2024 at 4.8300000
![]() The intermediate-term trend has been UP since Oct 4th, 2024 at 4.7793357
The intermediate-term trend has been UP since Oct 4th, 2024 at 4.7793357
![]() The short-term trend has been UP since Dec 17th, 2024 at 4.8846817
The short-term trend has been UP since Dec 17th, 2024 at 4.8846817
Smart Scan Analysis for USDLYD
Based on our trend formula, USDLYD is rated as a +70 on a scale from -100 (Strong Downtrend) to +100 (Strong Uptrend).
| Open | High | Low | Price | Change |
|---|---|---|---|---|
| 4.8938515 | 4.8938515 | 4.8938515 | 4.8938515 | 0.0000000 |
| Prev. Close | Volume | Bid | Ask | Time |
| 4.8938515 | 2024-12-21 06:23:54 |