Forex Trend Analysis Report
Prepared for you on Sunday, September 28, 2025.
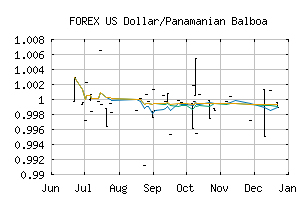
US Dollar/Panamanian Balboa (FOREX:USDPAB)
Bear Market Rally (-75) - USDPAB is showing some rallying power, but still remains in the confines of a long-term downtrend. Keep an eye on USDPAB as it may be in the beginning of a reversal.
Is it time to buy, sell, or avoid USDPAB?
MarketClub looks at technical strength and momentum to determine if the timing is right for USDPAB.
Learn more about the Trade Triangles and how we make technical analysis as easy as buy and sell.
|
|||||||||||||||
|
|||||||||||||||
MarketClub’s Trade Triangles for USDPAB
![]() The long-term trend has been DOWN since Feb 6th, 2025 at 0.9981438
The long-term trend has been DOWN since Feb 6th, 2025 at 0.9981438
![]() The intermediate-term trend has been UP since Aug 26th, 2025 at 1.0001073
The intermediate-term trend has been UP since Aug 26th, 2025 at 1.0001073
![]() The short-term trend has been DOWN since Sep 16th, 2025 at 0.9997870
The short-term trend has been DOWN since Sep 16th, 2025 at 0.9997870
Smart Scan Analysis for USDPAB
Based on our trend formula, USDPAB is rated as a -75 on a scale from -100 (Strong Downtrend) to +100 (Strong Uptrend).
| Open | High | Low | Price | Change |
|---|---|---|---|---|
| 0.9964544 | 0.9964544 | 0.9964544 | 0.9964544 | 0.0000000 |
| Prev. Close | Volume | Bid | Ask | Time |
| 0.9964544 | 2025-09-27 10:33:04 |