Forex Trend Analysis Report
Prepared for you on Thursday, April 9, 2026.
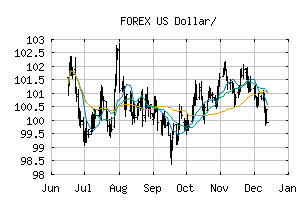
US Dollar/ (FOREX:USDRSD)
Weak Downtrend (-65) - USDRSD is showing signs of a strengthening downtrend. Monitor USDRSD as it may be building momentum to the downside.
Is it time to buy, sell, or avoid USDRSD?
MarketClub looks at technical strength and momentum to determine if the timing is right for USDRSD.
Learn more about the Trade Triangles and how we make technical analysis as easy as buy and sell.
|
|||||||||||||||
|
|||||||||||||||
MarketClub’s Trade Triangles for USDRSD
![]() The long-term trend has been UP since Mar 3rd, 2026 at 101.40500
The long-term trend has been UP since Mar 3rd, 2026 at 101.40500
![]() The intermediate-term trend has been DOWN since Apr 7th, 2026 at 100.93886
The intermediate-term trend has been DOWN since Apr 7th, 2026 at 100.93886
![]() The short-term trend has been DOWN since Mar 31st, 2026 at 101.47400
The short-term trend has been DOWN since Mar 31st, 2026 at 101.47400
Smart Scan Analysis for USDRSD
Based on our trend formula, USDRSD is rated as a -70 on a scale from -100 (Strong Downtrend) to +100 (Strong Uptrend).
| Open | High | Low | Price | Change |
|---|---|---|---|---|
| 100.6285 | 100.6990 | 100.3770 | 100.4480 | -0.1805 |
| Prev. Close | Volume | Bid | Ask | Time |
| 100.6285 | 2026-04-09 08:49:57 |