Forex Trend Analysis Report
Prepared for you on Saturday, December 13, 2025.
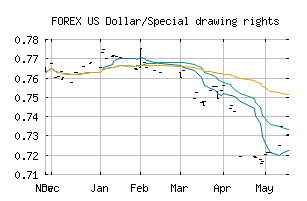
US Dollar/Special drawing rights (FOREX:USDXDR)
Weak Downtrend (-65) - USDXDR is showing signs of a strengthening downtrend. Monitor USDXDR as it may be building momentum to the downside.
Is it time to buy, sell, or avoid USDXDR?
MarketClub looks at technical strength and momentum to determine if the timing is right for USDXDR.
Learn more about the Trade Triangles and how we make technical analysis as easy as buy and sell.
|
|||||||||||||||
|
|||||||||||||||
MarketClub’s Trade Triangles for USDXDR
![]() The long-term trend has been UP since Nov 21st, 2025 at 0.7059139
The long-term trend has been UP since Nov 21st, 2025 at 0.7059139
![]() The intermediate-term trend has been DOWN since Nov 28th, 2025 at 0.7087781
The intermediate-term trend has been DOWN since Nov 28th, 2025 at 0.7087781
![]() The short-term trend has been DOWN since Dec 13th, 2025 at 0.7017846
The short-term trend has been DOWN since Dec 13th, 2025 at 0.7017846
Smart Scan Analysis for USDXDR
Based on our trend formula, USDXDR is rated as a -70 on a scale from -100 (Strong Downtrend) to +100 (Strong Uptrend).
| Open | High | Low | Price | Change |
|---|---|---|---|---|
| 0.6945639 | 0.6945639 | 0.6945639 | 0.6945639 | 0.0000000 |
| Prev. Close | Volume | Bid | Ask | Time |
| 0.6945639 | 2025-12-13 04:29:14 |