Forex Trend Analysis Report
Prepared for you on Wednesday, July 30, 2025.
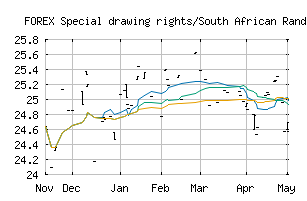
Special drawing rights/South African Rand (FOREX:XDRZAR)
Sidelines Mode (+55) - XDRZAR is moving in a sideways pattern and is unable to gain momentum in either direction. Beware of choppy movement and consider a sidelines position until a stronger trend is identified.
Is it time to buy, sell, or avoid XDRZAR?
MarketClub looks at technical strength and momentum to determine if the timing is right for XDRZAR.
Learn more about the Trade Triangles and how we make technical analysis as easy as buy and sell.
|
|||||||||||||||
|
|||||||||||||||
MarketClub’s Trade Triangles for XDRZAR
![]() The long-term trend has been UP since Dec 24th, 2024 at 23.998318
The long-term trend has been UP since Dec 24th, 2024 at 23.998318
![]() The intermediate-term trend has been DOWN since Jul 21st, 2025 at 25.385634
The intermediate-term trend has been DOWN since Jul 21st, 2025 at 25.385634
![]() The short-term trend has been UP since Jul 24th, 2025 at 25.298970
The short-term trend has been UP since Jul 24th, 2025 at 25.298970
Smart Scan Analysis for XDRZAR
Based on our trend formula, XDRZAR is rated as a +55 on a scale from -100 (Strong Downtrend) to +100 (Strong Uptrend).
| Open | High | Low | Price | Change |
|---|---|---|---|---|
| 25.583844 | 25.583844 | 25.583844 | 25.583844 | 0.000000 |
| Prev. Close | Volume | Bid | Ask | Time |
| 25.583844 | 2025-07-26 14:06:45 |