Forex Trend Analysis Report
Prepared for you on Saturday, April 4, 2026.
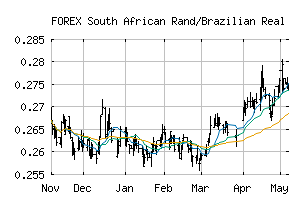
South African Rand/Brazilian Real (FOREX:ZARBRL)
Bear Market Rally (-75) - ZARBRL is showing some rallying power, but still remains in the confines of a long-term downtrend. Keep an eye on ZARBRL as it may be in the beginning of a reversal.
Is it time to buy, sell, or avoid ZARBRL?
MarketClub looks at technical strength and momentum to determine if the timing is right for ZARBRL.
Learn more about the Trade Triangles and how we make technical analysis as easy as buy and sell.
|
|||||||||||||||
|
|||||||||||||||
MarketClub’s Trade Triangles for ZARBRL
![]() The long-term trend has been DOWN since Mar 8th, 2026 at 0.31060067
The long-term trend has been DOWN since Mar 8th, 2026 at 0.31060067
![]() The intermediate-term trend has been DOWN since Feb 5th, 2026 at 0.32402954
The intermediate-term trend has been DOWN since Feb 5th, 2026 at 0.32402954
![]() The short-term trend has been UP since Apr 1st, 2026 at 0.30862788
The short-term trend has been UP since Apr 1st, 2026 at 0.30862788
Smart Scan Analysis for ZARBRL
Based on our trend formula, ZARBRL is rated as a -75 on a scale from -100 (Strong Downtrend) to +100 (Strong Uptrend).
| Open | High | Low | Price | Change |
|---|---|---|---|---|
| 0.30452340 | 0.30467009 | 0.30290344 | 0.30346195 | -0.00106100 |
| Prev. Close | Volume | Bid | Ask | Time |
| 0.30452340 | 2026-04-03 16:19:50 |