Forex Trend Analysis Report
Prepared for you on Monday, March 16, 2026.
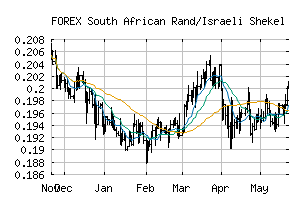
South African Rand/Israeli Shekel (FOREX:ZARILS)
Long-Term Downtrend (-90) - ZARILS is in a strong downtrend that is likely to continue. While ZARILS is showing intraday strength, it remains in the confines of a bearish trend. Traders should use caution and set stops.
Is it time to buy, sell, or avoid ZARILS?
MarketClub looks at technical strength and momentum to determine if the timing is right for ZARILS.
Learn more about the Trade Triangles and how we make technical analysis as easy as buy and sell.
|
|||||||||||||||
|
|||||||||||||||
MarketClub’s Trade Triangles for ZARILS
![]() The long-term trend has been DOWN since Mar 3rd, 2026 at 0.18800155
The long-term trend has been DOWN since Mar 3rd, 2026 at 0.18800155
![]() The intermediate-term trend has been DOWN since Mar 2nd, 2026 at 0.19157343
The intermediate-term trend has been DOWN since Mar 2nd, 2026 at 0.19157343
![]() The short-term trend has been DOWN since Mar 13th, 2026 at 0.18643529
The short-term trend has been DOWN since Mar 13th, 2026 at 0.18643529
Smart Scan Analysis for ZARILS
Based on our trend formula, ZARILS is rated as a -90 on a scale from -100 (Strong Downtrend) to +100 (Strong Uptrend).
| Open | High | Low | Price | Change |
|---|---|---|---|---|
| 0.18621116 | 0.18645288 | 0.18551393 | 0.18608102 | -0.00013000 |
| Prev. Close | Volume | Bid | Ask | Time |
| 0.18621116 | 2026-03-16 06:18:48 |