Forex Trend Analysis Report
Prepared for you on Saturday, August 30, 2025.
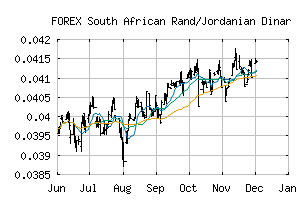
South African Rand/Jordanian Dinar (FOREX:ZARJOD)
Countertrend Up (+85) - ZARJOD is showing short-term weakness. However, look for the longer-term bullish trend to resume. As always, continue to monitor the trend score and utilize a stop order.
Is it time to buy, sell, or avoid ZARJOD?
MarketClub looks at technical strength and momentum to determine if the timing is right for ZARJOD.
Learn more about the Trade Triangles and how we make technical analysis as easy as buy and sell.
|
|||||||||||||||
|
|||||||||||||||
MarketClub’s Trade Triangles for ZARJOD
![]() The long-term trend has been UP since May 2nd, 2025 at 0.03927329
The long-term trend has been UP since May 2nd, 2025 at 0.03927329
![]() The intermediate-term trend has been UP since Aug 13th, 2025 at 0.04048852
The intermediate-term trend has been UP since Aug 13th, 2025 at 0.04048852
![]() The short-term trend has been UP since Aug 22nd, 2025 at 0.04024965
The short-term trend has been UP since Aug 22nd, 2025 at 0.04024965
Smart Scan Analysis for ZARJOD
Based on our trend formula, ZARJOD is rated as a +80 on a scale from -100 (Strong Downtrend) to +100 (Strong Uptrend).
| Open | High | Low | Price | Change |
|---|---|---|---|---|
| 0.04012435 | 0.04012435 | 0.04012435 | 0.04012435 | 0.00000000 |
| Prev. Close | Volume | Bid | Ask | Time |
| 0.04012435 | 2025-08-30 06:19:56 |