Forex Trend Analysis Report
Prepared for you on Sunday, March 22, 2026.
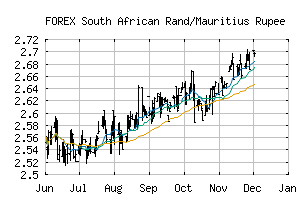
South African Rand/Mauritius Rupee (FOREX:ZARMUR)
Crossroads (-60) - ZARMUR is struggling to move into a solid trend. Beware of choppy markets and consider a sidelines position until a stronger trend is identified.
Is it time to buy, sell, or avoid ZARMUR?
MarketClub looks at technical strength and momentum to determine if the timing is right for ZARMUR.
Learn more about the Trade Triangles and how we make technical analysis as easy as buy and sell.
|
|||||||||||||||
|
|||||||||||||||
MarketClub’s Trade Triangles for ZARMUR
![]() The long-term trend has been UP since May 15th, 2025 at 2.5518727
The long-term trend has been UP since May 15th, 2025 at 2.5518727
![]() The intermediate-term trend has been DOWN since Mar 3rd, 2026 at 2.8514180
The intermediate-term trend has been DOWN since Mar 3rd, 2026 at 2.8514180
![]() The short-term trend has been DOWN since Feb 27th, 2026 at 2.8956097
The short-term trend has been DOWN since Feb 27th, 2026 at 2.8956097
Smart Scan Analysis for ZARMUR
Based on our trend formula, ZARMUR is rated as a -60 on a scale from -100 (Strong Downtrend) to +100 (Strong Uptrend).
| Open | High | Low | Price | Change |
|---|---|---|---|---|
| 2.7730194 | 2.7730194 | 2.7152725 | 2.7152725 | -0.0577470 |
| Prev. Close | Volume | Bid | Ask | Time |
| 2.7326458 | 2026-03-20 17:08:25 |