Forex Trend Analysis Report
Prepared for you on Tuesday, March 3, 2026.
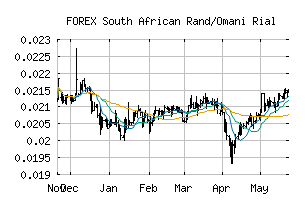
South African Rand/Omani Rial (FOREX:ZAROMR)
Weak Downtrend (-65) - ZAROMR is showing signs of a strengthening downtrend. Monitor ZAROMR as it may be building momentum to the downside.
Is it time to buy, sell, or avoid ZAROMR?
MarketClub looks at technical strength and momentum to determine if the timing is right for ZAROMR.
Learn more about the Trade Triangles and how we make technical analysis as easy as buy and sell.
|
|||||||||||||||
|
|||||||||||||||
MarketClub’s Trade Triangles for ZAROMR
![]() The long-term trend has been UP since May 2nd, 2025 at 0.02138622
The long-term trend has been UP since May 2nd, 2025 at 0.02138622
![]() The intermediate-term trend has been DOWN since Mar 1st, 2026 at 0.02370245
The intermediate-term trend has been DOWN since Mar 1st, 2026 at 0.02370245
![]() The short-term trend has been DOWN since Feb 27th, 2026 at 0.02395499
The short-term trend has been DOWN since Feb 27th, 2026 at 0.02395499
Smart Scan Analysis for ZAROMR
Based on our trend formula, ZAROMR is rated as a -70 on a scale from -100 (Strong Downtrend) to +100 (Strong Uptrend).
| Open | High | Low | Price | Change |
|---|---|---|---|---|
| 0.02385934 | 0.02389117 | 0.02294851 | 0.02330106 | -0.00055800 |
| Prev. Close | Volume | Bid | Ask | Time |
| 0.02385934 | 2026-03-03 18:06:11 |