Forex Trend Analysis Report
Prepared for you on Friday, May 9, 2025.
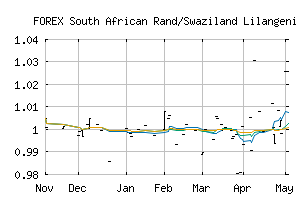
South African Rand/Swaziland Lilangeni (FOREX:ZARSZL)
Countertrend Up (+85) - ZARSZL is showing short-term weakness. However, look for the longer-term bullish trend to resume. As always, continue to monitor the trend score and utilize a stop order.
Is it time to buy, sell, or avoid ZARSZL?
MarketClub looks at technical strength and momentum to determine if the timing is right for ZARSZL.
Learn more about the Trade Triangles and how we make technical analysis as easy as buy and sell.
|
|||||||||||||||
|
|||||||||||||||
MarketClub’s Trade Triangles for ZARSZL
![]() The long-term trend has been UP since Apr 9th, 2025 at 1.0080335
The long-term trend has been UP since Apr 9th, 2025 at 1.0080335
![]() The intermediate-term trend has been UP since Apr 6th, 2025 at 1.0021171
The intermediate-term trend has been UP since Apr 6th, 2025 at 1.0021171
![]() The short-term trend has been UP since May 2nd, 2025 at 1.0084117
The short-term trend has been UP since May 2nd, 2025 at 1.0084117
Smart Scan Analysis for ZARSZL
Based on our trend formula, ZARSZL is rated as a +80 on a scale from -100 (Strong Downtrend) to +100 (Strong Uptrend).
| Open | High | Low | Price | Change |
|---|---|---|---|---|
| 1.0259363 | 1.0259363 | 1.0259363 | 1.0259363 | 0.0000000 |
| Prev. Close | Volume | Bid | Ask | Time |
| 1.0259363 | 2025-05-04 11:00:59 |