Forex Trend Analysis Report
Prepared for you on Monday, March 30, 2026.
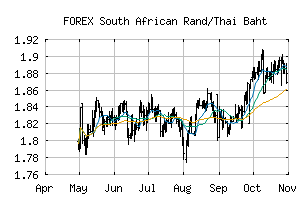
South African Rand/Thai Baht (FOREX:ZARTHB)
Weak Downtrend (-65) - ZARTHB is showing signs of a strengthening downtrend. Monitor ZARTHB as it may be building momentum to the downside.
Is it time to buy, sell, or avoid ZARTHB?
MarketClub looks at technical strength and momentum to determine if the timing is right for ZARTHB.
Learn more about the Trade Triangles and how we make technical analysis as easy as buy and sell.
|
|||||||||||||||
|
|||||||||||||||
MarketClub’s Trade Triangles for ZARTHB
![]() The long-term trend has been UP since Aug 22nd, 2025 at 1.8547267
The long-term trend has been UP since Aug 22nd, 2025 at 1.8547267
![]() The intermediate-term trend has been DOWN since Mar 2nd, 2026 at 1.9249659
The intermediate-term trend has been DOWN since Mar 2nd, 2026 at 1.9249659
![]() The short-term trend has been DOWN since Mar 29th, 2026 at 1.9115452
The short-term trend has been DOWN since Mar 29th, 2026 at 1.9115452
Smart Scan Analysis for ZARTHB
Based on our trend formula, ZARTHB is rated as a -70 on a scale from -100 (Strong Downtrend) to +100 (Strong Uptrend).
| Open | High | Low | Price | Change |
|---|---|---|---|---|
| 1.9003145 | 1.9233435 | 1.9003145 | 1.9126758 | +0.0123610 |
| Prev. Close | Volume | Bid | Ask | Time |
| 1.9003145 | 2026-03-30 05:21:52 |