Forex Trend Analysis Report
Prepared for you on Wednesday, March 11, 2026.
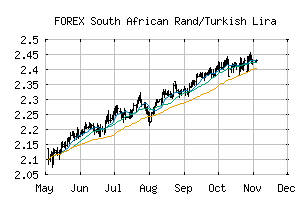
South African Rand/Turkish Lira (FOREX:ZARTRY)
Sidelines Mode (-55) - ZARTRY is moving in a sideways pattern and is unable to gain momentum in either direction. Beware of choppy movement and consider a sidelines position until a stronger trend is identified.
Is it time to buy, sell, or avoid ZARTRY?
MarketClub looks at technical strength and momentum to determine if the timing is right for ZARTRY.
Learn more about the Trade Triangles and how we make technical analysis as easy as buy and sell.
|
|||||||||||||||
|
|||||||||||||||
MarketClub’s Trade Triangles for ZARTRY
![]() The long-term trend has been UP since Mar 17th, 2025 at 2.0252757
The long-term trend has been UP since Mar 17th, 2025 at 2.0252757
![]() The intermediate-term trend has been DOWN since Mar 3rd, 2026 at 2.6979335
The intermediate-term trend has been DOWN since Mar 3rd, 2026 at 2.6979335
![]() The short-term trend has been UP since Mar 10th, 2026 at 2.7150990
The short-term trend has been UP since Mar 10th, 2026 at 2.7150990
Smart Scan Analysis for ZARTRY
Based on our trend formula, ZARTRY is rated as a -55 on a scale from -100 (Strong Downtrend) to +100 (Strong Uptrend).
| Open | High | Low | Price | Change |
|---|---|---|---|---|
| 2.7148032 | 2.7189376 | 2.7069573 | 2.7091509 | -0.0056520 |
| Prev. Close | Volume | Bid | Ask | Time |
| 2.7148032 | 2026-03-11 03:21:06 |