Forex Trend Analysis Report
Prepared for you on Wednesday, July 2, 2025.
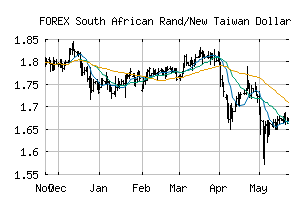
South African Rand/New Taiwan Dollar (FOREX:ZARTWD)
Countertrend Down (-85) - ZARTWD is showing short-term strength. However, look for the longer-term bearish trend to resume. As always, continue to monitor the trend score and set stops.
Is it time to buy, sell, or avoid ZARTWD?
MarketClub looks at technical strength and momentum to determine if the timing is right for ZARTWD.
Learn more about the Trade Triangles and how we make technical analysis as easy as buy and sell.
|
|||||||||||||||
|
|||||||||||||||
MarketClub’s Trade Triangles for ZARTWD
![]() The long-term trend has been DOWN since Dec 18th, 2024 at 1.7706656
The long-term trend has been DOWN since Dec 18th, 2024 at 1.7706656
![]() The intermediate-term trend has been DOWN since Jun 12th, 2025 at 1.6545516
The intermediate-term trend has been DOWN since Jun 12th, 2025 at 1.6545516
![]() The short-term trend has been UP since Jul 1st, 2025 at 1.6569148
The short-term trend has been UP since Jul 1st, 2025 at 1.6569148
Smart Scan Analysis for ZARTWD
Based on our trend formula, ZARTWD is rated as a -85 on a scale from -100 (Strong Downtrend) to +100 (Strong Uptrend).
| Open | High | Low | Price | Change |
|---|---|---|---|---|
| 1.6519151 | 1.6552217 | 1.6374876 | 1.6393689 | -0.0125460 |
| Prev. Close | Volume | Bid | Ask | Time |
| 1.6519151 | 2025-07-02 22:46:34 |