Forex Trend Analysis Report
Prepared for you on Sunday, March 29, 2026.
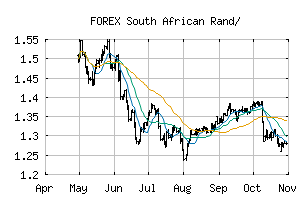
South African Rand/ (FOREX:ZARZMW)
Strong Downtrend (-100) - ZARZMW is in a strong downtrend that is likely to continue. With short-term, intermediate, and long-term bearish momentum, ZARZMW continues to fall. Traders should use caution and set stops.
Is it time to buy, sell, or avoid ZARZMW?
MarketClub looks at technical strength and momentum to determine if the timing is right for ZARZMW.
Learn more about the Trade Triangles and how we make technical analysis as easy as buy and sell.
|
|||||||||||||||
|
|||||||||||||||
MarketClub’s Trade Triangles for ZARZMW
![]() The long-term trend has been DOWN since Jan 7th, 2026 at 1.2594267
The long-term trend has been DOWN since Jan 7th, 2026 at 1.2594267
![]() The intermediate-term trend has been DOWN since Dec 29th, 2025 at 1.3459241
The intermediate-term trend has been DOWN since Dec 29th, 2025 at 1.3459241
![]() The short-term trend has been DOWN since Mar 19th, 2026 at 1.1545295
The short-term trend has been DOWN since Mar 19th, 2026 at 1.1545295
Smart Scan Analysis for ZARZMW
Based on our trend formula, ZARZMW is rated as a -100 on a scale from -100 (Strong Downtrend) to +100 (Strong Uptrend).
| Open | High | Low | Price | Change |
|---|---|---|---|---|
| 1.0996867 | 1.1027151 | 1.0924938 | 1.0971275 | -0.0025590 |
| Prev. Close | Volume | Bid | Ask | Time |
| 1.0971275 | 2026-03-27 17:07:34 |