Free Stock Trend Analysis Report
Buy, Sell or Hold? We'll analyze any stock symbol for free using our market-proven, technical analysis tools.
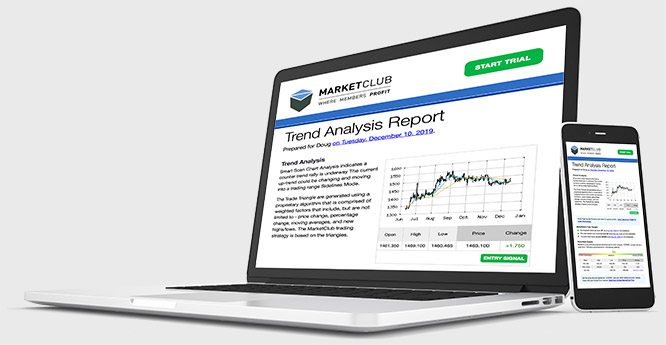
Where is the trend headed and how much momentum is driving it? Our free report will give you the stock trend outlook.
Enter any symbol for a free, instant analysis.