Index Trend Analysis Report
Prepared for you on Thursday, December 26, 2024.
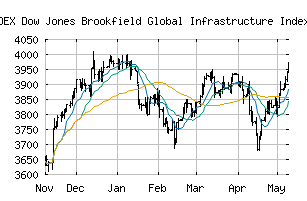
Dow Jones Brookfield Global Infrastructure Index (USD) (INDEX:DJBGI)
Countertrend Down (-85) - DJBGI is showing short-term strength. However, look for the longer-term bearish trend to resume. As always, continue to monitor the trend score and set stops.
Is it time to buy, sell, or avoid DJBGI?
MarketClub looks at technical strength and momentum to determine if the timing is right for DJBGI.
Learn more about the Trade Triangles and how we make technical analysis as easy as buy and sell.
|
|||||||||||||||
|
|||||||||||||||
MarketClub’s Trade Triangles for DJBGI
![]() The long-term trend has been DOWN since Dec 16th, 2024 at 4274.51
The long-term trend has been DOWN since Dec 16th, 2024 at 4274.51
![]() The intermediate-term trend has been DOWN since Dec 10th, 2024 at 4372.11
The intermediate-term trend has been DOWN since Dec 10th, 2024 at 4372.11
![]() The short-term trend has been UP since Dec 23rd, 2024 at 4199.42
The short-term trend has been UP since Dec 23rd, 2024 at 4199.42
Smart Scan Analysis for DJBGI
Based on our trend formula, DJBGI is rated as a -85 on a scale from -100 (Strong Downtrend) to +100 (Strong Uptrend).
| Open | High | Low | Price | Change |
|---|---|---|---|---|
| 4234.52 | 4235.19 | 4215.66 | 4216.44 | -18.46 |
| Prev. Close | Volume | Bid | Ask | Time |
| 4234.90 | 0 | 2024-12-26 10:33:49 |
| 52wk High | 3715.85 | 52wk High Date | 2017-12-04 |
| 52wk Low | 3328.07 | 52wk Low Date | 2018-02-09 |