Index Trend Analysis Report
Prepared for you on Wednesday, November 27, 2024.
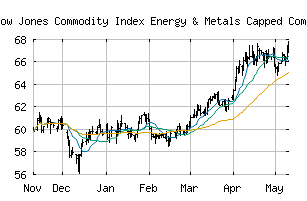
Dow Jones Commodity Index Energy & Metals Capped Component TR (INDEX:DJCIEMCT)
Crossroads (+60) - DJCIEMCT is struggling to move into a solid trend. Beware of choppy markets and consider a sidelines position until a stronger trend is identified.
Is it time to buy, sell, or avoid DJCIEMCT?
MarketClub looks at technical strength and momentum to determine if the timing is right for DJCIEMCT.
Learn more about the Trade Triangles and how we make technical analysis as easy as buy and sell.
|
|||||||||||||||
|
|||||||||||||||
MarketClub’s Trade Triangles for DJCIEMCT
![]() The long-term trend has been UP since Oct 3rd, 2024 at 68.963
The long-term trend has been UP since Oct 3rd, 2024 at 68.963
![]() The intermediate-term trend has been DOWN since Nov 3rd, 2024 at 65.361
The intermediate-term trend has been DOWN since Nov 3rd, 2024 at 65.361
![]() The short-term trend has been DOWN since Nov 25th, 2024 at 65.638
The short-term trend has been DOWN since Nov 25th, 2024 at 65.638
Smart Scan Analysis for DJCIEMCT
Based on our trend formula, DJCIEMCT is rated as a +60 on a scale from -100 (Strong Downtrend) to +100 (Strong Uptrend).
| Open | High | Low | Price | Change |
|---|---|---|---|---|
| 65.576 | 65.664 | 65.424 | 65.560 | -0.045 |
| Prev. Close | Volume | Bid | Ask | Time |
| 65.605 | 0 | 2024-11-27 03:17:09 |