Index Trend Analysis Report
Prepared for you on Thursday, April 10, 2025.
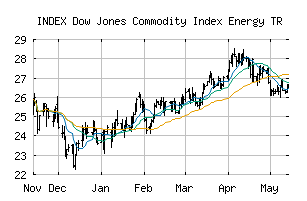
Dow Jones Commodity Index Energy TR (INDEX:DJCIENT)
Strong Downtrend (-100) - DJCIENT is in a strong downtrend that is likely to continue. With short-term, intermediate, and long-term bearish momentum, DJCIENT continues to fall. Traders should use caution and set stops.
Is it time to buy, sell, or avoid DJCIENT?
MarketClub looks at technical strength and momentum to determine if the timing is right for DJCIENT.
Learn more about the Trade Triangles and how we make technical analysis as easy as buy and sell.
|
|||||||||||||||
|
|||||||||||||||
MarketClub’s Trade Triangles for DJCIENT
![]() The long-term trend has been DOWN since Apr 4th, 2025 at 25.606
The long-term trend has been DOWN since Apr 4th, 2025 at 25.606
![]() The intermediate-term trend has been DOWN since Apr 4th, 2025 at 25.621
The intermediate-term trend has been DOWN since Apr 4th, 2025 at 25.621
![]() The short-term trend has been DOWN since Apr 3rd, 2025 at 26.924
The short-term trend has been DOWN since Apr 3rd, 2025 at 26.924
Smart Scan Analysis for DJCIENT
Based on our trend formula, DJCIENT is rated as a -100 on a scale from -100 (Strong Downtrend) to +100 (Strong Uptrend).
| Open | High | Low | Price | Change |
|---|---|---|---|---|
| 24.210 | 24.445 | 23.296 | 23.626 | -0.598 |
| Prev. Close | Volume | Bid | Ask | Time |
| 24.224 | 0 | 2025-04-10 10:29:09 |