Index Trend Analysis Report
Prepared for you on Wednesday, April 8, 2026.
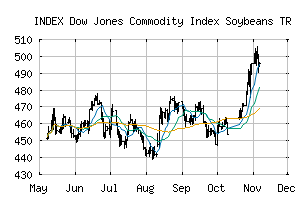
Dow Jones Commodity Index Soybeans TR (INDEX:DJCISOT)
Crossroads (-60) - DJCISOT is struggling to move into a solid trend. Beware of choppy markets and consider a sidelines position until a stronger trend is identified.
Is it time to buy, sell, or avoid DJCISOT?
MarketClub looks at technical strength and momentum to determine if the timing is right for DJCISOT.
Learn more about the Trade Triangles and how we make technical analysis as easy as buy and sell.
|
|||||||||||||||
|
|||||||||||||||
MarketClub’s Trade Triangles for DJCISOT
![]() The long-term trend has been UP since Oct 26th, 2025 at 476.14
The long-term trend has been UP since Oct 26th, 2025 at 476.14
![]() The intermediate-term trend has been DOWN since Apr 7th, 2026 at 505.67
The intermediate-term trend has been DOWN since Apr 7th, 2026 at 505.67
![]() The short-term trend has been DOWN since Apr 1st, 2026 at 510.25
The short-term trend has been DOWN since Apr 1st, 2026 at 510.25
Smart Scan Analysis for DJCISOT
Based on our trend formula, DJCISOT is rated as a -60 on a scale from -100 (Strong Downtrend) to +100 (Strong Uptrend).
| Open | High | Low | Price | Change |
|---|---|---|---|---|
| 510.00 | 511.44 | 509.78 | 510.99 | +0.77 |
| Prev. Close | Volume | Bid | Ask | Time |
| 510.22 | 0 | 2026-04-08 05:12:49 |