Index Trend Analysis Report
Prepared for you on Tuesday, March 24, 2026.
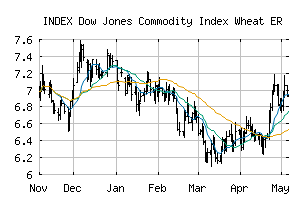
Dow Jones Commodity Index Wheat ER (INDEX:DJCIWHP)
Weak Uptrend (+65) - DJCIWHP is showing signs of weakening momentum to the upside. Monitor DJCIWHP as it may be in the beginning stages of a reversal.
Is it time to buy, sell, or avoid DJCIWHP?
MarketClub looks at technical strength and momentum to determine if the timing is right for DJCIWHP.
Learn more about the Trade Triangles and how we make technical analysis as easy as buy and sell.
|
|||||||||||||||
|
|||||||||||||||
MarketClub’s Trade Triangles for DJCIWHP
![]() The long-term trend has been UP since Feb 20th, 2026 at 5.0619
The long-term trend has been UP since Feb 20th, 2026 at 5.0619
![]() The intermediate-term trend has been UP since Jan 12th, 2026 at 4.6526
The intermediate-term trend has been UP since Jan 12th, 2026 at 4.6526
![]() The short-term trend has been DOWN since Mar 23rd, 2026 at 5.1718
The short-term trend has been DOWN since Mar 23rd, 2026 at 5.1718
Smart Scan Analysis for DJCIWHP
Based on our trend formula, DJCIWHP is rated as a +65 on a scale from -100 (Strong Downtrend) to +100 (Strong Uptrend).
| Open | High | Low | Price | Change |
|---|---|---|---|---|
| 5.1696 | 5.1914 | 5.0802 | 5.1718 | 0.0000 |
| Prev. Close | Volume | Bid | Ask | Time |
| 5.1718 | 0 | 2026-03-24 13:40:19 |