Index Trend Analysis Report
Prepared for you on Tuesday, July 1, 2025.
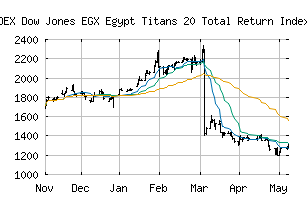
Dow Jones EGX Egypt Titans 20 Total Return Index (USD) (INDEX:DJEG20DT)
Long-Term Uptrend (+90) - DJEG20DT is in a strong uptrend that is likely to continue. While DJEG20DT is showing intraday weakness, it remains in the confines of a bullish trend. Traders should use caution and utilize a stop order.
Is it time to buy, sell, or avoid DJEG20DT?
MarketClub looks at technical strength and momentum to determine if the timing is right for DJEG20DT.
Learn more about the Trade Triangles and how we make technical analysis as easy as buy and sell.
|
|||||||||||||||
|
|||||||||||||||
MarketClub’s Trade Triangles for DJEG20DT
![]() The long-term trend has been UP since Mar 23rd, 2025 at 1457.65
The long-term trend has been UP since Mar 23rd, 2025 at 1457.65
![]() The intermediate-term trend has been UP since Jun 30th, 2025 at 1550.00
The intermediate-term trend has been UP since Jun 30th, 2025 at 1550.00
![]() The short-term trend has been UP since Jun 24th, 2025 at 1447.10
The short-term trend has been UP since Jun 24th, 2025 at 1447.10
Smart Scan Analysis for DJEG20DT
Based on our trend formula, DJEG20DT is rated as a +90 on a scale from -100 (Strong Downtrend) to +100 (Strong Uptrend).
| Open | High | Low | Price | Change |
|---|---|---|---|---|
| 1528.37 | 1536.69 | 1526.91 | 1531.04 | +1.20 |
| Prev. Close | Volume | Bid | Ask | Time |
| 1529.84 | 0 | 2025-07-01 06:21:28 |
| 52wk High | 1551.51 | 52wk High Date | 2018-04-29 |
| 52wk Low | 1121.17 | 52wk Low Date | 2018-10-11 |