Index Trend Analysis Report
Prepared for you on Tuesday, March 10, 2026.
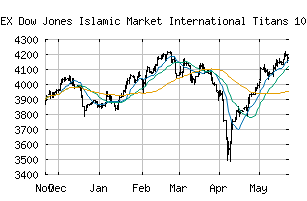
Dow Jones Islamic Market International Titans 100 Index (INDEX:DJI100X)
Weak Downtrend (-65) - DJI100X is showing signs of a strengthening downtrend. Monitor DJI100X as it may be building momentum to the downside.
Is it time to buy, sell, or avoid DJI100X?
MarketClub looks at technical strength and momentum to determine if the timing is right for DJI100X.
Learn more about the Trade Triangles and how we make technical analysis as easy as buy and sell.
|
|||||||||||||||
|
|||||||||||||||
MarketClub’s Trade Triangles for DJI100X
![]() The long-term trend has been UP since Jun 4th, 2025 at 4216.85
The long-term trend has been UP since Jun 4th, 2025 at 4216.85
![]() The intermediate-term trend has been DOWN since Mar 3rd, 2026 at 5157.07
The intermediate-term trend has been DOWN since Mar 3rd, 2026 at 5157.07
![]() The short-term trend has been DOWN since Mar 1st, 2026 at 5518.84
The short-term trend has been DOWN since Mar 1st, 2026 at 5518.84
Smart Scan Analysis for DJI100X
Based on our trend formula, DJI100X is rated as a -70 on a scale from -100 (Strong Downtrend) to +100 (Strong Uptrend).
| Open | High | Low | Price | Change |
|---|---|---|---|---|
| 5088.04 | 5176.46 | 5087.15 | 5147.10 | +35.14 |
| Prev. Close | Volume | Bid | Ask | Time |
| 5111.96 | 0 | 2026-03-10 16:19:59 |
| 52wk High | 3156.28 | 52wk High Date | 2018-01-29 |
| 52wk Low | 2580.32 | 52wk Low Date | 2018-10-26 |