Index Trend Analysis Report
Prepared for you on Wednesday, March 12, 2025.
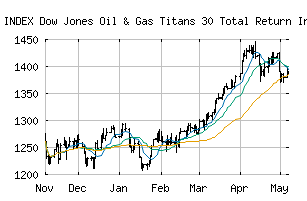
Dow Jones Oil & Gas Titans 30 Total Return Index (INDEX:DJTENGT)
Countertrend Down (-85) - DJTENGT is showing short-term strength. However, look for the longer-term bearish trend to resume. As always, continue to monitor the trend score and set stops.
Is it time to buy, sell, or avoid DJTENGT?
MarketClub looks at technical strength and momentum to determine if the timing is right for DJTENGT.
Learn more about the Trade Triangles and how we make technical analysis as easy as buy and sell.
|
|||||||||||||||
|
|||||||||||||||
MarketClub’s Trade Triangles for DJTENGT
![]() The long-term trend has been DOWN since Dec 17th, 2024 at 1275.41
The long-term trend has been DOWN since Dec 17th, 2024 at 1275.41
![]() The intermediate-term trend has been DOWN since Mar 3rd, 2025 at 1319.89
The intermediate-term trend has been DOWN since Mar 3rd, 2025 at 1319.89
![]() The short-term trend has been UP since Mar 7th, 2025 at 1316.23
The short-term trend has been UP since Mar 7th, 2025 at 1316.23
Smart Scan Analysis for DJTENGT
Based on our trend formula, DJTENGT is rated as a -85 on a scale from -100 (Strong Downtrend) to +100 (Strong Uptrend).
| Open | High | Low | Price | Change |
|---|---|---|---|---|
| 1310.56 | 1326.74 | 1309.03 | 1319.98 | +9.17 |
| Prev. Close | Volume | Bid | Ask | Time |
| 1310.81 | 0 | 2025-03-12 16:34:23 |
| 52wk High | 1034.3 | 52wk High Date | 2018-05-22 |
| 52wk Low | 851.97 | 52wk Low Date | 2018-02-09 |