Index Trend Analysis Report
Prepared for you on Tuesday, March 3, 2026.
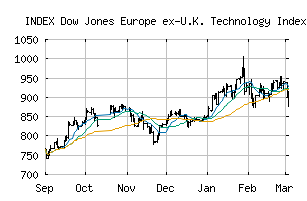
Dow Jones Europe ex-U.K. Technology Index (INDEX:E2TEC)
Weak Downtrend (-65) - E2TEC is showing signs of a strengthening downtrend. Monitor E2TEC as it may be building momentum to the downside.
Is it time to buy, sell, or avoid E2TEC?
MarketClub looks at technical strength and momentum to determine if the timing is right for E2TEC.
Learn more about the Trade Triangles and how we make technical analysis as easy as buy and sell.
|
|||||||||||||||
|
|||||||||||||||
MarketClub’s Trade Triangles for E2TEC
![]() The long-term trend has been UP since May 21st, 2025 at 795.48
The long-term trend has been UP since May 21st, 2025 at 795.48
![]() The intermediate-term trend has been DOWN since Mar 3rd, 2026 at 889.33
The intermediate-term trend has been DOWN since Mar 3rd, 2026 at 889.33
![]() The short-term trend has been DOWN since Feb 27th, 2026 at 922.45
The short-term trend has been DOWN since Feb 27th, 2026 at 922.45
Smart Scan Analysis for E2TEC
Based on our trend formula, E2TEC is rated as a -70 on a scale from -100 (Strong Downtrend) to +100 (Strong Uptrend).
| Open | High | Low | Price | Change |
|---|---|---|---|---|
| 915.56 | 915.78 | 882.30 | 885.58 | -30.57 |
| Prev. Close | Volume | Bid | Ask | Time |
| 916.15 | 0 | 2026-03-03 04:13:45 |
| 52wk High | 434.3 | 52wk High Date | 2018-06-15 |
| 52wk Low | 327 | 52wk Low Date | 2018-11-20 |