Mutual Trend Analysis Report
Prepared for you on Tuesday, March 24, 2026.
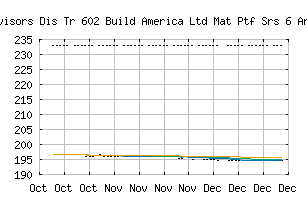
Advisors Dis Tr 602 Build America Ltd Mat Ptf Srs 6 An SMC FIM Ptf (NASDAQ:AAMBWX)
Strong Downtrend (-100) - AAMBWX is in a strong downtrend that is likely to continue. With short-term, intermediate, and long-term bearish momentum, AAMBWX continues to fall. Traders should use caution and set stops.
Is it time to buy, sell, or avoid AAMBWX?
MarketClub looks at technical strength and momentum to determine if the timing is right for AAMBWX.
Learn more about the Trade Triangles and how we make technical analysis as easy as buy and sell.
|
|||||||||||||||
|
|||||||||||||||
MarketClub’s Trade Triangles for AAMBWX
![]() The long-term trend has been DOWN since Sep 10th, 2024 at 311.73
The long-term trend has been DOWN since Sep 10th, 2024 at 311.73
![]() The intermediate-term trend has been DOWN since Sep 10th, 2024 at 314.75
The intermediate-term trend has been DOWN since Sep 10th, 2024 at 314.75
![]() The short-term trend has been DOWN since Sep 18th, 2024 at 233.29
The short-term trend has been DOWN since Sep 18th, 2024 at 233.29
Smart Scan Analysis for AAMBWX
Based on our trend formula, AAMBWX is rated as a -100 on a scale from -100 (Strong Downtrend) to +100 (Strong Uptrend).
| Open | High | Low | Price | Change |
|---|---|---|---|---|
| 233.03 | 233.03 | 233.03 | 171.99 | -0.13 |
| Prev. Close | Volume | Bid | Ask | Time |
| 232.97 | 0 | 232.97 | 578.37 | 2026-03-24 00:00:00 |
| 52wk High | 578.37 | 52wk High Date | 2026-03-13 |
| 52wk Low | 171.81 | 52wk Low Date | 2026-03-13 |
| Year End Close | 332.99 | Yield | 3.577 |
| Payment Date | 2026-03-25 |