Mutual Trend Analysis Report
Prepared for you on Saturday, March 21, 2026.
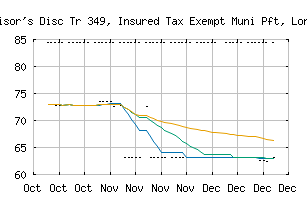
Advisor's Disc Tr 349, Insured Tax Exempt Muni Pft, Long Term Srs 2 (NASDAQ:AAMEEX)
Weak Uptrend (+65) - AAMEEX is showing signs of weakening momentum to the upside. Monitor AAMEEX as it may be in the beginning stages of a reversal.
Is it time to buy, sell, or avoid AAMEEX?
MarketClub looks at technical strength and momentum to determine if the timing is right for AAMEEX.
Learn more about the Trade Triangles and how we make technical analysis as easy as buy and sell.
|
|||||||||||||||
|
|||||||||||||||
MarketClub’s Trade Triangles for AAMEEX
![]() The long-term trend has been UP since Sep 17th, 2024 at 84.59
The long-term trend has been UP since Sep 17th, 2024 at 84.59
![]() The intermediate-term trend has been UP since Jul 11th, 2024 at 83.84
The intermediate-term trend has been UP since Jul 11th, 2024 at 83.84
![]() The short-term trend has been DOWN since Sep 19th, 2024 at 84.57
The short-term trend has been DOWN since Sep 19th, 2024 at 84.57
Smart Scan Analysis for AAMEEX
Based on our trend formula, AAMEEX is rated as a +65 on a scale from -100 (Strong Downtrend) to +100 (Strong Uptrend).
| Open | High | Low | Price | Change |
|---|---|---|---|---|
| 84.53 | 84.53 | 84.53 | 62.74 | 0.00 |
| Prev. Close | Volume | Bid | Ask | Time |
| 84.53 | 0 | 84.51 | 106.79 | 2026-03-21 00:00:00 |
| 52wk High | 106.79 | 52wk High Date | 2026-03-12 |
| 52wk Low | 62.46 | 52wk Low Date | 2025-12-26 |
| Year End Close | 86.91 | Yield | 2.35 |
| Payment Date | 2026-03-25 |