Mutual Trend Analysis Report
Prepared for you on Wednesday, March 4, 2026.
GS Finance Corp. Capped Dual Directional Worst Of Buffer Note ABDISXX (NASDAQ:ABDISXX)
Countertrend Up (+85) - ABDISXX is showing short-term weakness. However, look for the longer-term bullish trend to resume. As always, continue to monitor the trend score and utilize a stop order.
Is it time to buy, sell, or avoid ABDISXX?
MarketClub looks at technical strength and momentum to determine if the timing is right for ABDISXX.
Learn more about the Trade Triangles and how we make technical analysis as easy as buy and sell.
|
|||||||||||||||
|
|||||||||||||||
MarketClub’s Trade Triangles for ABDISXX
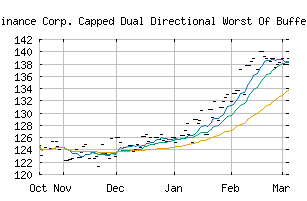
![]() The long-term trend has been UP since Nov 28th, 2025 at 125.34
The long-term trend has been UP since Nov 28th, 2025 at 125.34
![]() The intermediate-term trend has been UP since Nov 28th, 2025 at 124.83
The intermediate-term trend has been UP since Nov 28th, 2025 at 124.83
![]() The short-term trend has been DOWN since Mar 2nd, 2026 at 137.92
The short-term trend has been DOWN since Mar 2nd, 2026 at 137.92
Smart Scan Analysis for ABDISXX
Based on our trend formula, ABDISXX is rated as a +85 on a scale from -100 (Strong Downtrend) to +100 (Strong Uptrend).
| Open | High | Low | Price | Change |
|---|---|---|---|---|
| 138.89 | 138.89 | 138.89 | 138.89 | |
| Prev. Close | Volume | Bid | Ask | Time |
| 138.89 | 0 | 2026-03-04 00:00:00 |