Mutual Trend Analysis Report
Prepared for you on Saturday, April 4, 2026.
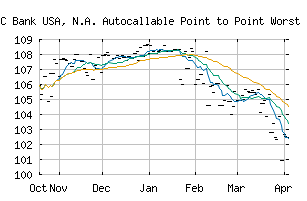
HSBC Bank USA, N.A. Autocallable Point to Point Worst Of CD ABKIWXX (NASDAQ:ABKIWXX)
Long-Term Downtrend (-90) - ABKIWXX is in a strong downtrend that is likely to continue. While ABKIWXX is showing intraday strength, it remains in the confines of a bearish trend. Traders should use caution and set stops.
Is it time to buy, sell, or avoid ABKIWXX?
MarketClub looks at technical strength and momentum to determine if the timing is right for ABKIWXX.
Learn more about the Trade Triangles and how we make technical analysis as easy as buy and sell.
|
|||||||||||||||
|
|||||||||||||||
MarketClub’s Trade Triangles for ABKIWXX
![]() The long-term trend has been DOWN since Feb 9th, 2026 at 106.00
The long-term trend has been DOWN since Feb 9th, 2026 at 106.00
![]() The intermediate-term trend has been DOWN since Jan 22nd, 2026 at 107.84
The intermediate-term trend has been DOWN since Jan 22nd, 2026 at 107.84
![]() The short-term trend has been DOWN since Mar 30th, 2026 at 102.34
The short-term trend has been DOWN since Mar 30th, 2026 at 102.34
Smart Scan Analysis for ABKIWXX
Based on our trend formula, ABKIWXX is rated as a -90 on a scale from -100 (Strong Downtrend) to +100 (Strong Uptrend).
| Open | High | Low | Price | Change |
|---|---|---|---|---|
| 102.45 | 102.45 | 102.45 | 102.45 | |
| Prev. Close | Volume | Bid | Ask | Time |
| 102.45 | 0 | 2026-04-04 00:00:00 |