Mutual Trend Analysis Report
Prepared for you on Friday, April 3, 2026.
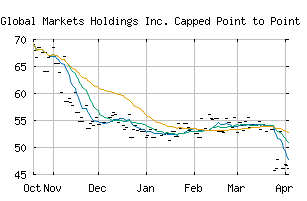
Citigroup Global Markets Holdings Inc. Capped Point to Point Buffer Note ABKQMXX (NASDAQ:ABKQMXX)
Long-Term Downtrend (-90) - ABKQMXX is in a strong downtrend that is likely to continue. While ABKQMXX is showing intraday strength, it remains in the confines of a bearish trend. Traders should use caution and set stops.
Is it time to buy, sell, or avoid ABKQMXX?
MarketClub looks at technical strength and momentum to determine if the timing is right for ABKQMXX.
Learn more about the Trade Triangles and how we make technical analysis as easy as buy and sell.
|
|||||||||||||||
|
|||||||||||||||
MarketClub’s Trade Triangles for ABKQMXX
![]() The long-term trend has been DOWN since Oct 21st, 2025 at 69.10
The long-term trend has been DOWN since Oct 21st, 2025 at 69.10
![]() The intermediate-term trend has been DOWN since Mar 25th, 2026 at 52.75
The intermediate-term trend has been DOWN since Mar 25th, 2026 at 52.75
![]() The short-term trend has been DOWN since Mar 30th, 2026 at 46.20
The short-term trend has been DOWN since Mar 30th, 2026 at 46.20
Smart Scan Analysis for ABKQMXX
Based on our trend formula, ABKQMXX is rated as a -90 on a scale from -100 (Strong Downtrend) to +100 (Strong Uptrend).
| Open | High | Low | Price | Change |
|---|---|---|---|---|
| 46.2 | 46.2 | 46.2 | 46.2 | |
| Prev. Close | Volume | Bid | Ask | Time |
| 46.2 | 0 | 2026-04-03 00:00:00 |