Mutual Trend Analysis Report
Prepared for you on Sunday, February 8, 2026.
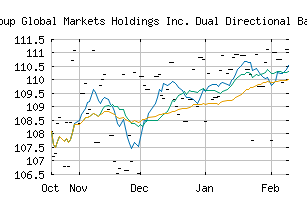
Citigroup Global Markets Holdings Inc. Dual Directional Barrier Note ABSIYXX (NASDAQ:ABSIYXX)
Countertrend Up (+85) - ABSIYXX is showing short-term weakness. However, look for the longer-term bullish trend to resume. As always, continue to monitor the trend score and utilize a stop order.
Is it time to buy, sell, or avoid ABSIYXX?
MarketClub looks at technical strength and momentum to determine if the timing is right for ABSIYXX.
Learn more about the Trade Triangles and how we make technical analysis as easy as buy and sell.
|
|||||||||||||||
|
|||||||||||||||
MarketClub’s Trade Triangles for ABSIYXX
![]() The long-term trend has been UP since Jan 30th, 2026 at 111.11
The long-term trend has been UP since Jan 30th, 2026 at 111.11
![]() The intermediate-term trend has been UP since Jan 30th, 2026 at 110.96
The intermediate-term trend has been UP since Jan 30th, 2026 at 110.96
![]() The short-term trend has been DOWN since Feb 1st, 2026 at 109.76
The short-term trend has been DOWN since Feb 1st, 2026 at 109.76
Smart Scan Analysis for ABSIYXX
Based on our trend formula, ABSIYXX is rated as a +85 on a scale from -100 (Strong Downtrend) to +100 (Strong Uptrend).
| Open | High | Low | Price | Change |
|---|---|---|---|---|
| 111.12 | 111.12 | 111.12 | 111.12 | |
| Prev. Close | Volume | Bid | Ask | Time |
| 111.12 | 0 | 2026-02-08 00:00:00 |