Mutual Trend Analysis Report
Prepared for you on Saturday, December 6, 2025.
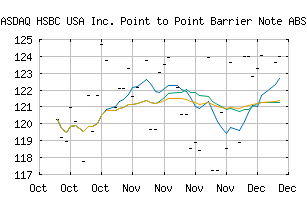
HSBC USA Inc. Point to Point Barrier Note ABSYIXX (NASDAQ:ABSYIXX)
Bull Market Weakness (+75) - ABSYIXX is showing signs of short-term weakness, but still remains in the confines of a long-term uptrend. Keep an eye on ABSYIXX as it may be in the beginning stages of a reversal.
Is it time to buy, sell, or avoid ABSYIXX?
MarketClub looks at technical strength and momentum to determine if the timing is right for ABSYIXX.
Learn more about the Trade Triangles and how we make technical analysis as easy as buy and sell.
|
|||||||||||||||
|
|||||||||||||||
MarketClub’s Trade Triangles for ABSYIXX
![]() The long-term trend has been DOWN since Nov 24th, 2025 at 117.78
The long-term trend has been DOWN since Nov 24th, 2025 at 117.78
![]() The intermediate-term trend has been UP since Dec 1st, 2025 at 123.91
The intermediate-term trend has been UP since Dec 1st, 2025 at 123.91
![]() The short-term trend has been UP since Nov 28th, 2025 at 120.66
The short-term trend has been UP since Nov 28th, 2025 at 120.66
Smart Scan Analysis for ABSYIXX
Based on our trend formula, ABSYIXX is rated as a +70 on a scale from -100 (Strong Downtrend) to +100 (Strong Uptrend).
| Open | High | Low | Price | Change |
|---|---|---|---|---|
| 123.66 | 123.66 | 123.66 | 123.66 | |
| Prev. Close | Volume | Bid | Ask | Time |
| 123.66 | 0 | 2025-12-06 00:00:00 |