Mutual Trend Analysis Report
Prepared for you on Wednesday, December 17, 2025.
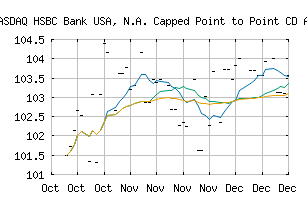
HSBC Bank USA, N.A. Capped Point to Point CD ACBPDXX (NASDAQ:ACBPDXX)
Crossroads (-60) - ACBPDXX is struggling to move into a solid trend. Beware of choppy markets and consider a sidelines position until a stronger trend is identified.
Is it time to buy, sell, or avoid ACBPDXX?
MarketClub looks at technical strength and momentum to determine if the timing is right for ACBPDXX.
Learn more about the Trade Triangles and how we make technical analysis as easy as buy and sell.
|
|||||||||||||||
|
|||||||||||||||
MarketClub’s Trade Triangles for ACBPDXX
![]() The long-term trend has been UP since Oct 30th, 2025 at 103.07
The long-term trend has been UP since Oct 30th, 2025 at 103.07
![]() The intermediate-term trend has been DOWN since Nov 24th, 2025 at 102.25
The intermediate-term trend has been DOWN since Nov 24th, 2025 at 102.25
![]() The short-term trend has been DOWN since Dec 15th, 2025 at 103.57
The short-term trend has been DOWN since Dec 15th, 2025 at 103.57
Smart Scan Analysis for ACBPDXX
Based on our trend formula, ACBPDXX is rated as a -60 on a scale from -100 (Strong Downtrend) to +100 (Strong Uptrend).
| Open | High | Low | Price | Change |
|---|---|---|---|---|
| 103.09 | 103.09 | 103.09 | 103.09 | |
| Prev. Close | Volume | Bid | Ask | Time |
| 103.09 | 0 | 2025-12-17 00:00:00 |