Stock Trend Analysis Report
Prepared for you on Saturday, April 20, 2024.
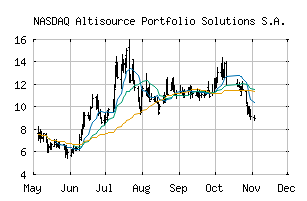
Altisource Portfolio Solutions S.A. (NASDAQ:ASPS)
Countertrend Down (-85) - ASPS is showing short-term strength. However, look for the longer-term bearish trend to resume. As always, continue to monitor the trend score and set stops.
Is it time to buy, sell, or avoid ASPS?
MarketClub looks at technical strength and momentum to determine if the timing is right for ASPS.
Learn more about the Trade Triangles and how we make technical analysis as easy as buy and sell.
|
|||||||||||||||
|
|||||||||||||||
MarketClub’s Trade Triangles for ASPS
![]() The long-term trend has been DOWN since Sep 8th, 2023 at 3.850
The long-term trend has been DOWN since Sep 8th, 2023 at 3.850
![]() The intermediate-term trend has been DOWN since Mar 11th, 2024 at 2.640
The intermediate-term trend has been DOWN since Mar 11th, 2024 at 2.640
![]() The short-term trend has been UP since Apr 19th, 2024 at 1.568
The short-term trend has been UP since Apr 19th, 2024 at 1.568
Smart Scan Analysis for ASPS
Based on our trend formula, ASPS is rated as a -85 on a scale from -100 (Strong Downtrend) to +100 (Strong Uptrend).
| Open | High | Low | Price | Change |
|---|---|---|---|---|
| 1.54 | 1.73 | 1.52 | 1.63 | +0.09 |
| Prev. Close | Volume | Bid | Ask | Time |
| 1.65 | 142916 | 2024-04-19 15:58:35 |
| Year High | 37.86 | Year High Date | 2018-08-22 |
| Year Low | 21.05 | Year Low Date | 2018-11-12 |
| 52wk High | 6.79 | 52wk High Date | 2023-06-21 |
| 52wk Low | 1.3804 | 52wk Low Date | 2024-04-10 |
| Year End Close | 86.655 | Average Volume | 183,216 |
| Shares Outstanding | 26,570 | Short Interest | 119,227 |
| % Institutional | 63 | Market Cap | 352M |
| Assets | 154,858,000M | Liabilities | 280,528,000M |
| P/E Ratio | 2.4293 | Beta | 0.51 |
| Volatility | 48.89 |