Index Trend Analysis Report
Prepared for you on Wednesday, February 25, 2026.
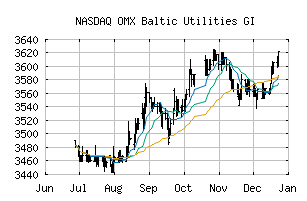
OMX Baltic Utilities GI (NASDAQ:B65GI)
Crossroads (-60) - B65GI is struggling to move into a solid trend. Beware of choppy markets and consider a sidelines position until a stronger trend is identified.
Is it time to buy, sell, or avoid B65GI?
MarketClub looks at technical strength and momentum to determine if the timing is right for B65GI.
Learn more about the Trade Triangles and how we make technical analysis as easy as buy and sell.
|
|||||||||||||||
|
|||||||||||||||
MarketClub’s Trade Triangles for B65GI
![]() The long-term trend has been UP since Jan 6th, 2025 at 3178.62
The long-term trend has been UP since Jan 6th, 2025 at 3178.62
![]() The intermediate-term trend has been DOWN since Feb 18th, 2026 at 3792.20
The intermediate-term trend has been DOWN since Feb 18th, 2026 at 3792.20
![]() The short-term trend has been DOWN since Feb 24th, 2026 at 3801.83
The short-term trend has been DOWN since Feb 24th, 2026 at 3801.83
Smart Scan Analysis for B65GI
Based on our trend formula, B65GI is rated as a -60 on a scale from -100 (Strong Downtrend) to +100 (Strong Uptrend).
| Open | High | Low | Price | Change |
|---|---|---|---|---|
| 3803.91 | 3803.91 | 3743.55 | 3766.19 | -37.72 |
| Prev. Close | Volume | Bid | Ask | Time |
| 3803.91 | 0 | 2026-02-25 09:04:00 |