Mutual Trend Analysis Report
Prepared for you on Friday, July 26, 2024.
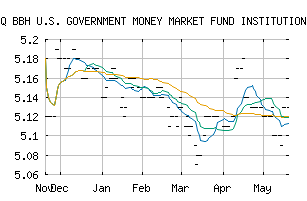
BBH U.S. GOVERNMENT MONEY MARKET FUND INSTITUTIONAL SHARES (NASDAQ:BBSXX)
Countertrend Up (+85) - BBSXX is showing short-term weakness. However, look for the longer-term bullish trend to resume. As always, continue to monitor the trend score and utilize a stop order.
Is it time to buy, sell, or avoid BBSXX?
MarketClub looks at technical strength and momentum to determine if the timing is right for BBSXX.
Learn more about the Trade Triangles and how we make technical analysis as easy as buy and sell.
|
|||||||||||||||
|
|||||||||||||||
MarketClub’s Trade Triangles for BBSXX
![]() The long-term trend has been UP since Apr 16th, 2024 at 5.17
The long-term trend has been UP since Apr 16th, 2024 at 5.17
![]() The intermediate-term trend has been UP since Jul 23rd, 2024 at 5.13
The intermediate-term trend has been UP since Jul 23rd, 2024 at 5.13
![]() The short-term trend has been UP since Jul 17th, 2024 at 5.11
The short-term trend has been UP since Jul 17th, 2024 at 5.11
Smart Scan Analysis for BBSXX
Based on our trend formula, BBSXX is rated as a +80 on a scale from -100 (Strong Downtrend) to +100 (Strong Uptrend).
| Open | High | Low | Price | Change |
|---|---|---|---|---|
| 0.00 | 5.14 | 5.14 | 1.00 | 0.00 |
| Prev. Close | Volume | Bid | Ask | Time |
| 0.00 | 655650 | 36.00 | 2024-07-24 18:45:00 |
| 52wk High | 5.42 | 52wk High Date | 2023-10-16 |
| 52wk Low | 4.9 | 52wk Low Date | 2023-07-27 |
| Average Volume | 34 |