Mutual Trend Analysis Report
Prepared for you on Saturday, April 4, 2026.
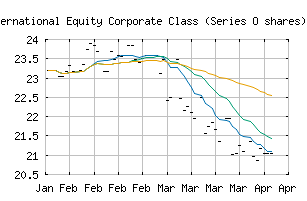
CI International Equity Corporate Class (Series O shares) U$ NL (312184A2) (NASDAQ:CEUMX)
Long-Term Downtrend (-90) - CEUMX is in a strong downtrend that is likely to continue. While CEUMX is showing intraday strength, it remains in the confines of a bearish trend. Traders should use caution and set stops.
Is it time to buy, sell, or avoid CEUMX?
MarketClub looks at technical strength and momentum to determine if the timing is right for CEUMX.
Learn more about the Trade Triangles and how we make technical analysis as easy as buy and sell.
|
|||||||||||||||
|
|||||||||||||||
MarketClub’s Trade Triangles for CEUMX
![]() The long-term trend has been DOWN since Mar 5th, 2026 at 23.0322
The long-term trend has been DOWN since Mar 5th, 2026 at 23.0322
![]() The intermediate-term trend has been DOWN since Mar 3rd, 2026 at 23.1597
The intermediate-term trend has been DOWN since Mar 3rd, 2026 at 23.1597
![]() The short-term trend has been DOWN since Mar 30th, 2026 at 21.1072
The short-term trend has been DOWN since Mar 30th, 2026 at 21.1072
Smart Scan Analysis for CEUMX
Based on our trend formula, CEUMX is rated as a -90 on a scale from -100 (Strong Downtrend) to +100 (Strong Uptrend).
| Open | High | Low | Price | Change |
|---|---|---|---|---|
| 21.0544 | 21.0544 | 21.0544 | 21.0544 | +0.2087 |
| Prev. Close | Volume | Bid | Ask | Time |
| 21.0544 | 0 | 2026-04-04 00:00:00 |