Index Trend Analysis Report
Prepared for you on Tuesday, March 17, 2026.
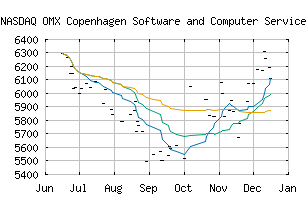
OMX Copenhagen Software and Computer Services GI (NASDAQ:CX101010GI)
Sidelines Mode (+50) - CX101010GI is failing to move into a strong trend and is encountering choppy trading conditions. Be cautious and consider taking a sidelines position until CX101010GI can gain momentum.
Is it time to buy, sell, or avoid CX101010GI?
MarketClub looks at technical strength and momentum to determine if the timing is right for CX101010GI.
Learn more about the Trade Triangles and how we make technical analysis as easy as buy and sell.
|
|||||||||||||||
|
|||||||||||||||
MarketClub’s Trade Triangles for CX101010GI
![]() The long-term trend has been DOWN since Feb 11th, 2026 at 5675.54
The long-term trend has been DOWN since Feb 11th, 2026 at 5675.54
![]() The intermediate-term trend has been UP since Mar 4th, 2026 at 5849.47
The intermediate-term trend has been UP since Mar 4th, 2026 at 5849.47
![]() The short-term trend has been UP since Mar 4th, 2026 at 5541.20
The short-term trend has been UP since Mar 4th, 2026 at 5541.20
Smart Scan Analysis for CX101010GI
Based on our trend formula, CX101010GI is rated as a +50 on a scale from -100 (Strong Downtrend) to +100 (Strong Uptrend).
| Open | High | Low | Price | Change |
|---|---|---|---|---|
| 5880.66 | 5880.66 | 5880.66 | 5880.66 | +148.95 |
| Prev. Close | Volume | Bid | Ask | Time |
| 6054.14 | 0 | 2026-03-04 11:05:00 |