Index Trend Analysis Report
Prepared for you on Friday, April 19, 2024.
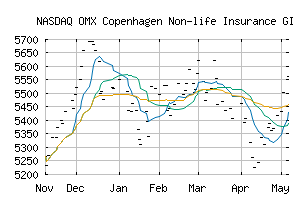
OMX Copenhagen Non-life Insurance GI (NASDAQ:CX303020GI)
Bear Market Rally (-75) - CX303020GI is showing some rallying power, but still remains in the confines of a long-term downtrend. Keep an eye on CX303020GI as it may be in the beginning of a reversal.
Is it time to buy, sell, or avoid CX303020GI?
MarketClub looks at technical strength and momentum to determine if the timing is right for CX303020GI.
Learn more about the Trade Triangles and how we make technical analysis as easy as buy and sell.
|
|||||||||||||||
|
|||||||||||||||
MarketClub’s Trade Triangles for CX303020GI
![]() The long-term trend has been DOWN since Apr 10th, 2024 at 5310.49
The long-term trend has been DOWN since Apr 10th, 2024 at 5310.49
![]() The intermediate-term trend has been DOWN since Mar 15th, 2024 at 5475.44
The intermediate-term trend has been DOWN since Mar 15th, 2024 at 5475.44
![]() The short-term trend has been UP since Apr 17th, 2024 at 5264.20
The short-term trend has been UP since Apr 17th, 2024 at 5264.20
Smart Scan Analysis for CX303020GI
Based on our trend formula, CX303020GI is rated as a -75 on a scale from -100 (Strong Downtrend) to +100 (Strong Uptrend).
| Open | High | Low | Price | Change |
|---|---|---|---|---|
| 5312.56 | 5312.56 | 5312.56 | 5312.56 | -20.70 |
| Prev. Close | Volume | Bid | Ask | Time |
| 5333.26 | 0 | 2024-04-19 11:05:00 |