Index Trend Analysis Report
Prepared for you on Friday, December 5, 2025.
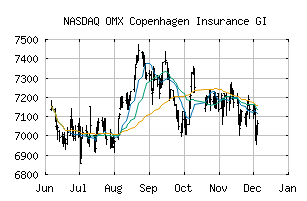
OMX Copenhagen Insurance GI (NASDAQ:CX3030GI)
Long-Term Downtrend (-90) - CX3030GI is in a strong downtrend that is likely to continue. While CX3030GI is showing intraday strength, it remains in the confines of a bearish trend. Traders should use caution and set stops.
Is it time to buy, sell, or avoid CX3030GI?
MarketClub looks at technical strength and momentum to determine if the timing is right for CX3030GI.
Learn more about the Trade Triangles and how we make technical analysis as easy as buy and sell.
|
|||||||||||||||
|
|||||||||||||||
MarketClub’s Trade Triangles for CX3030GI
![]() The long-term trend has been DOWN since Dec 3rd, 2025 at 6996.68
The long-term trend has been DOWN since Dec 3rd, 2025 at 6996.68
![]() The intermediate-term trend has been DOWN since Nov 19th, 2025 at 7058.94
The intermediate-term trend has been DOWN since Nov 19th, 2025 at 7058.94
![]() The short-term trend has been DOWN since Dec 3rd, 2025 at 7091.48
The short-term trend has been DOWN since Dec 3rd, 2025 at 7091.48
Smart Scan Analysis for CX3030GI
Based on our trend formula, CX3030GI is rated as a -90 on a scale from -100 (Strong Downtrend) to +100 (Strong Uptrend).
| Open | High | Low | Price | Change |
|---|---|---|---|---|
| 7049.60 | 7080.33 | 7008.86 | 7064.80 | +21.90 |
| Prev. Close | Volume | Bid | Ask | Time |
| 7042.90 | 0 | 2025-12-05 11:04:00 |