Index Trend Analysis Report
Prepared for you on Tuesday, October 22, 2024.
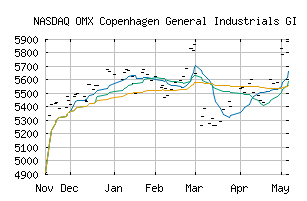
OMX Copenhagen General Industrials GI (NASDAQ:CX502030GI)
Countertrend Up (+85) - CX502030GI is showing short-term weakness. However, look for the longer-term bullish trend to resume. As always, continue to monitor the trend score and utilize a stop order.
Is it time to buy, sell, or avoid CX502030GI?
MarketClub looks at technical strength and momentum to determine if the timing is right for CX502030GI.
Learn more about the Trade Triangles and how we make technical analysis as easy as buy and sell.
|
|||||||||||||||
|
|||||||||||||||
MarketClub’s Trade Triangles for CX502030GI
![]() The long-term trend has been UP since Aug 29th, 2024 at 6288.58
The long-term trend has been UP since Aug 29th, 2024 at 6288.58
![]() The intermediate-term trend has been UP since Aug 20th, 2024 at 6085.88
The intermediate-term trend has been UP since Aug 20th, 2024 at 6085.88
![]() The short-term trend has been UP since Oct 21st, 2024 at 6498.61
The short-term trend has been UP since Oct 21st, 2024 at 6498.61
Smart Scan Analysis for CX502030GI
Based on our trend formula, CX502030GI is rated as a +80 on a scale from -100 (Strong Downtrend) to +100 (Strong Uptrend).
| Open | High | Low | Price | Change |
|---|---|---|---|---|
| 6512.42 | 6512.42 | 6512.42 | 6512.42 | -16.65 |
| Prev. Close | Volume | Bid | Ask | Time |
| 6529.07 | 0 | 2024-10-22 11:05:00 |